
Shareholder maps reveal far more than who owns what. When read thoughtfully, they expose patterns of control, influence, and ownership structures that are difficult to spot in traditional ownership tables. T-rank’s Shareholder Maps have builtin visual cues that make complex shareholder networks far easier to navigate, explore and explain.
Spotting Control
This is an example of a large shareholder map.
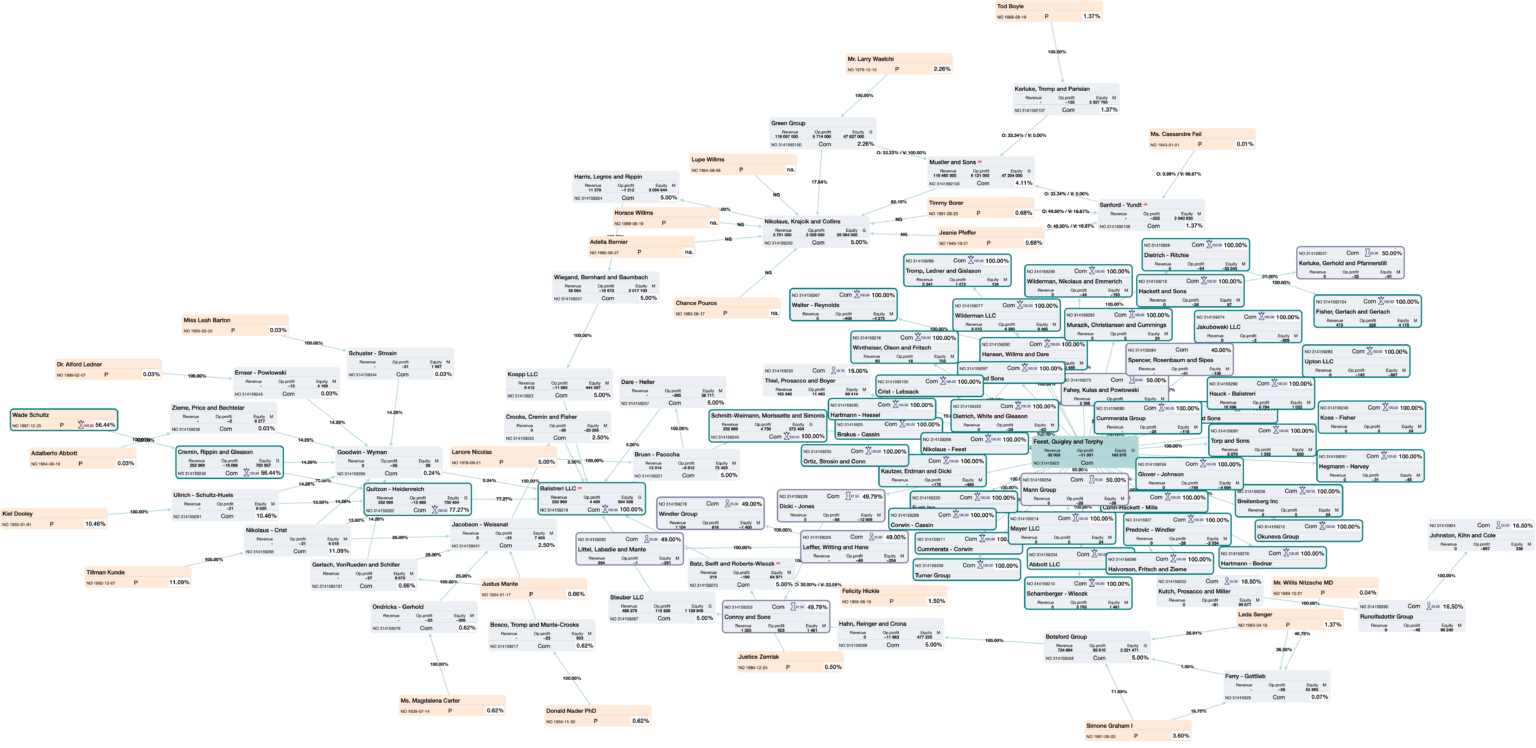
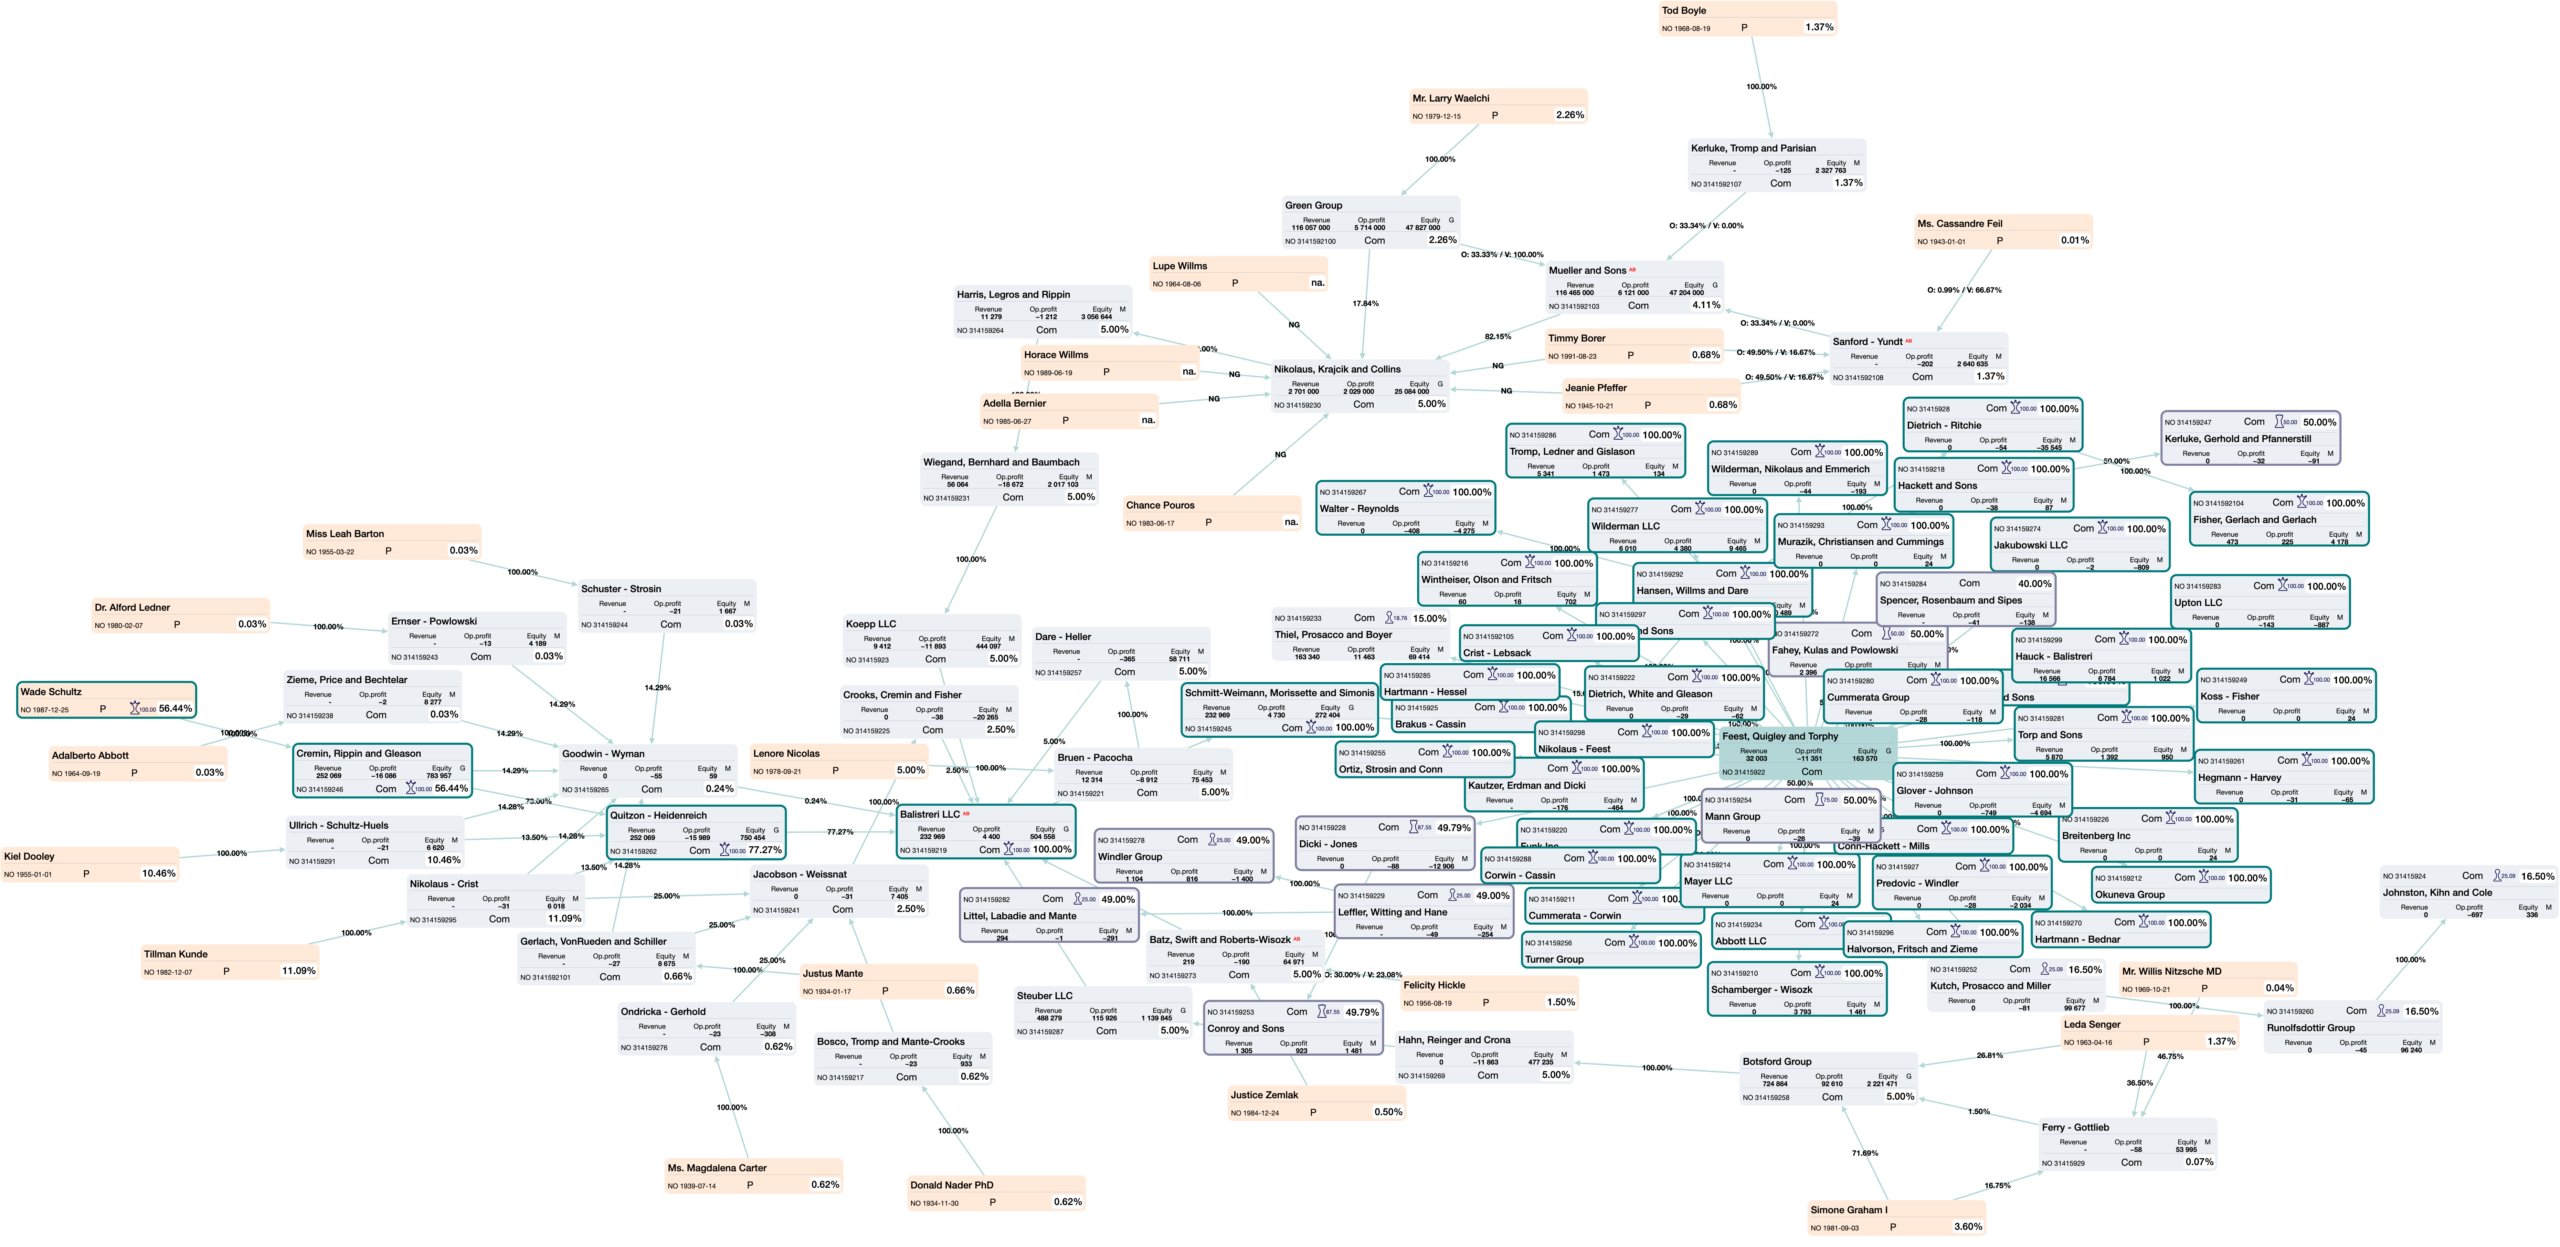
In this version of the shareholder map we see both owners and holdings of the company of interest: Feest, Quigley and Torphy. The company that we are investigating is easy to spot due to its green box.
Looking more closely at the shareholder map, we see that the green color is also used in enhancing the frames of other entities in the map. The color green carries “control”. Upstream from the company of interest we can trace the controlling ownership and find the beneficial owner of the company. In this particular shareholder map the path is the following: Feest, Quigley and Torphy is owned by Schmitt-Weimann, Morissette, and Simonis, which is in turn owned through a chain comprising Balistreri LLC, Quitzon – Heidenreich, and Cremin, Rippin and Gleason, and finally ending up at the beneficial owner Wade Schultz.
Similarly, downstream from the company of interest we can trace the companies which are controlled by Feest, Quigley and Torphy by visually identifying entities that have the bold green frame. In this case, there are at least two dozen companies that are 100% owned and controlled by Feest, Quigley and Torphy.
Using Thresholds
We can use different mechanisms to highlight information encoded in a shareholder map. When the size of a map increases, the number of entities to visualize can introduce clutter and confusion.
There are several levers we can utilize to avoid this and improve clarity:
- – Choosing different map layouts and types
- – Choosing the maximum number of entities displayed in the visualized shareholder map
- – Setting a non-zero threshold for minimum integrated ownership to filter out entities having negligible ownership
Current map layouts include directional layouts such as: top-down, bottom-up, left-right, and right-left, as well as the star-based network layout (used in the above example). These are straightforward choices that an investigator can explore and try out on the shareholder structure under investigation. There are also different types of map: owners, holdings, owners & holdings, beneficial owners, and board network that will highlight different aspects of the ownership structure.
Setting the maximum number of entities that will be visualized in a map is an obvious way to limit the clutter in the shareholder map. This will remove nodes in the periphery of the shareholder map, and retain entities close (in terms of network hops) to the entity under inspection.
Similarly, filtering out entities that have an integrated ownership share below the set threshold is also a viable approach in reducing clutter. Not showing these entities will then better highlight the remaining entities that are most likely more relevant for the entity under investigation.
You might wonder: What happens if an entity has integrated ownership below the set threshold, and at the same time high voting power? No worries! There is a check for exactly this. We make sure that these special cases are in fact included in the shareholder map and not filtered out. Similarly, when entities are excluded due to the maximum number of entities threshold, the user is clearly alerted about this–and given the chance to modify the threshold limit accordingly.
Major Owners
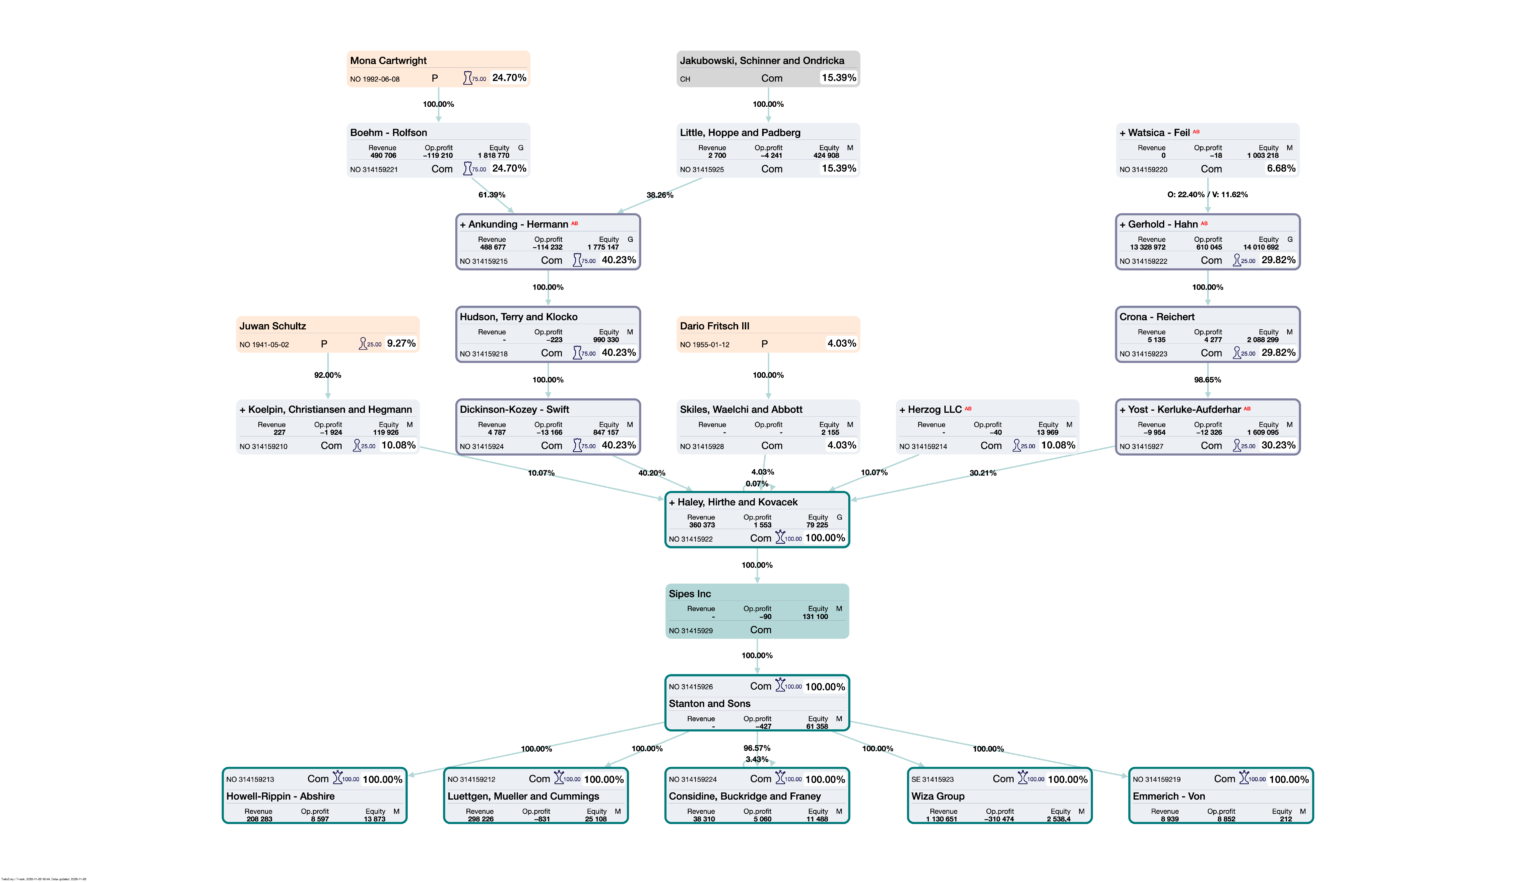
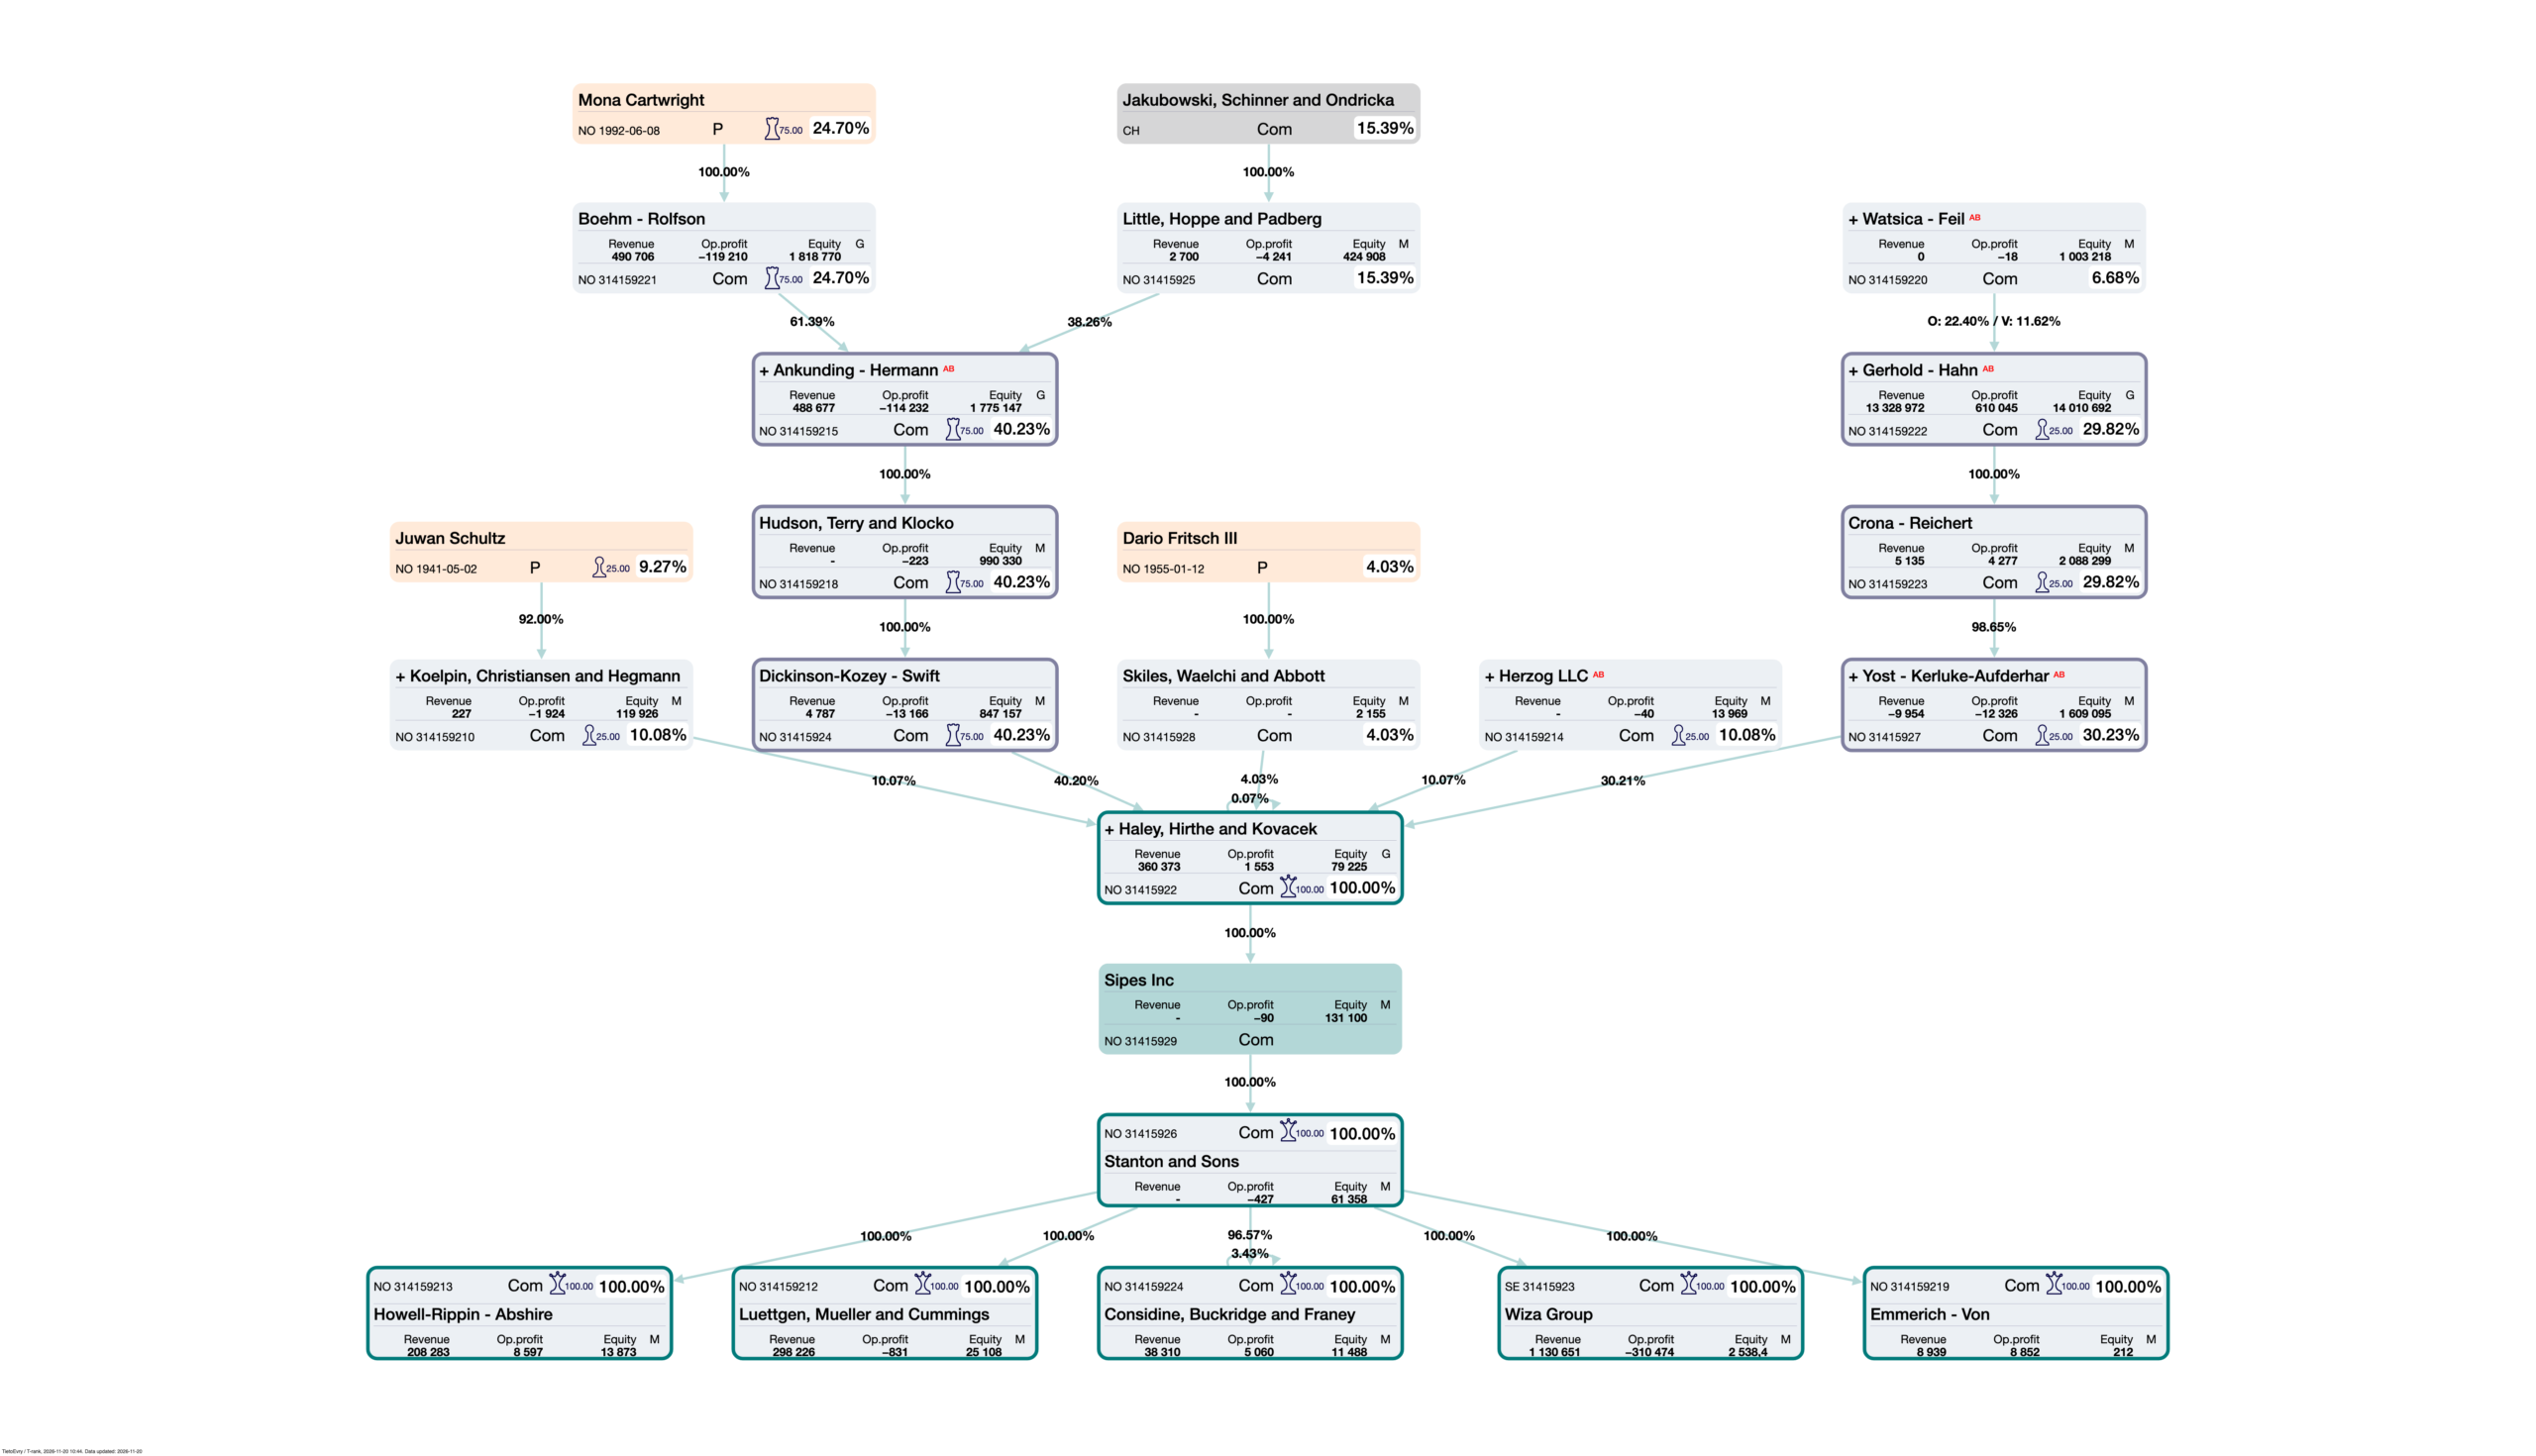
This example demonstrates how shareholder maps visually highlight major owners. While green indicates control, dark purple highlights entities with significant ownership.
In the example above, the subject company—Sipes Inc—is immediately recognizable. One can also easily identify six downstream entities controlled by Sipes Inc, alongside the upstream controlling entity, Haley, Hirthe and Kovacek.
Upon closer examination, two ownership chains featuring major shareholdings (exceeding 25%) are highlighted with dark purple frames. These chains run through Dickinson-Kozey – Swift and Yost – Kerluke-Aufderhar, making significant ownership paths far easier to trace.
We believe that all of these “tricks” will help you in the task of navigating, understanding and extracting essential and important information from shareholder maps. Avoid clutter and chaos and efficiently get hold of relevant information needed in your work.
Summary and Takeaways
Network visualizations from other tools can look impressive at first glance, but what sets T-rank apart is our pre-calculated integrated ownership and voting power. This is hugely important, because it allows us to instantly filter out the noise and guarantee a clean, helpful, and truly readable map every single time.
Key features that enhance clarity in shareholder maps include:
- – Highlighting Control: Controlling relationships are immediately identifiable through distinct bold green frames on entity nodes. This runs both up- and downstream, easily revealing beneficial owners and fully controlled holdings.
- – Using Thresholds: Maps can display entities that satisfy integrated ownership thresholds while also including nodes with high Voting Power. This ensures high-influence entities remain visible.
- – Highlighting Major Owners: Key shareholders and significant holding entities can visually be emphasized through dark purple frames for instant recognition.
More News & Thoughts
- – T-rank Now Speaks MCP! – T-rank.no (2026.10.15)
- – The Danish Beneficial Ownership Register – T-rank.no (2026.09.18)
Written by Kenth Engø-Monsen – kenth (at) trank (dot) no